Free AI State Diagram Maker
Transform state machine descriptions into professional state diagrams instantly. Describe your states and transitions - AI creates the visual state machine.
Order lifecycle as a state diagram
The most common state-diagram use case.
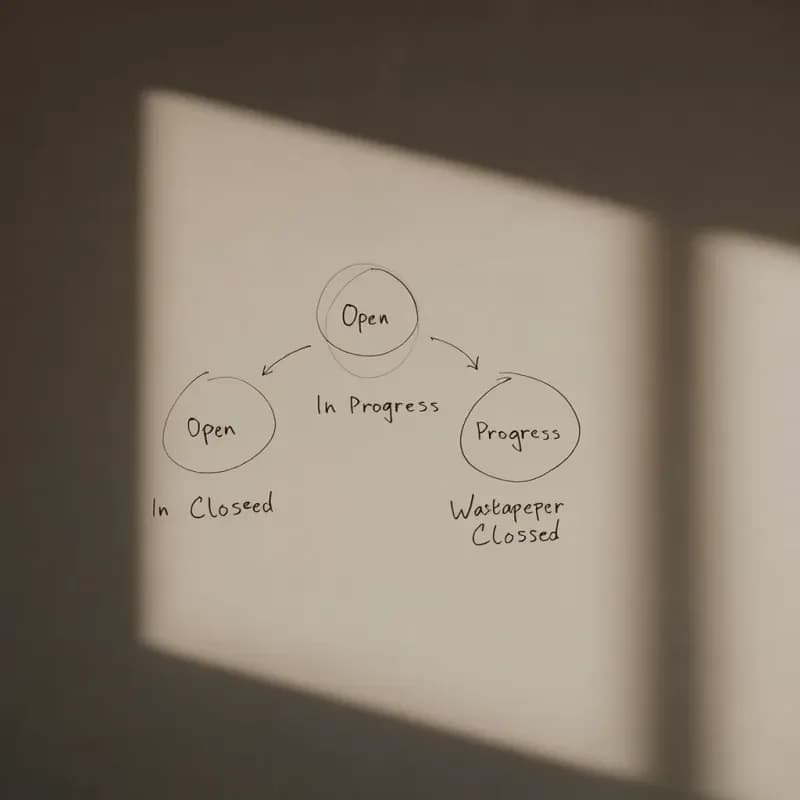
Input
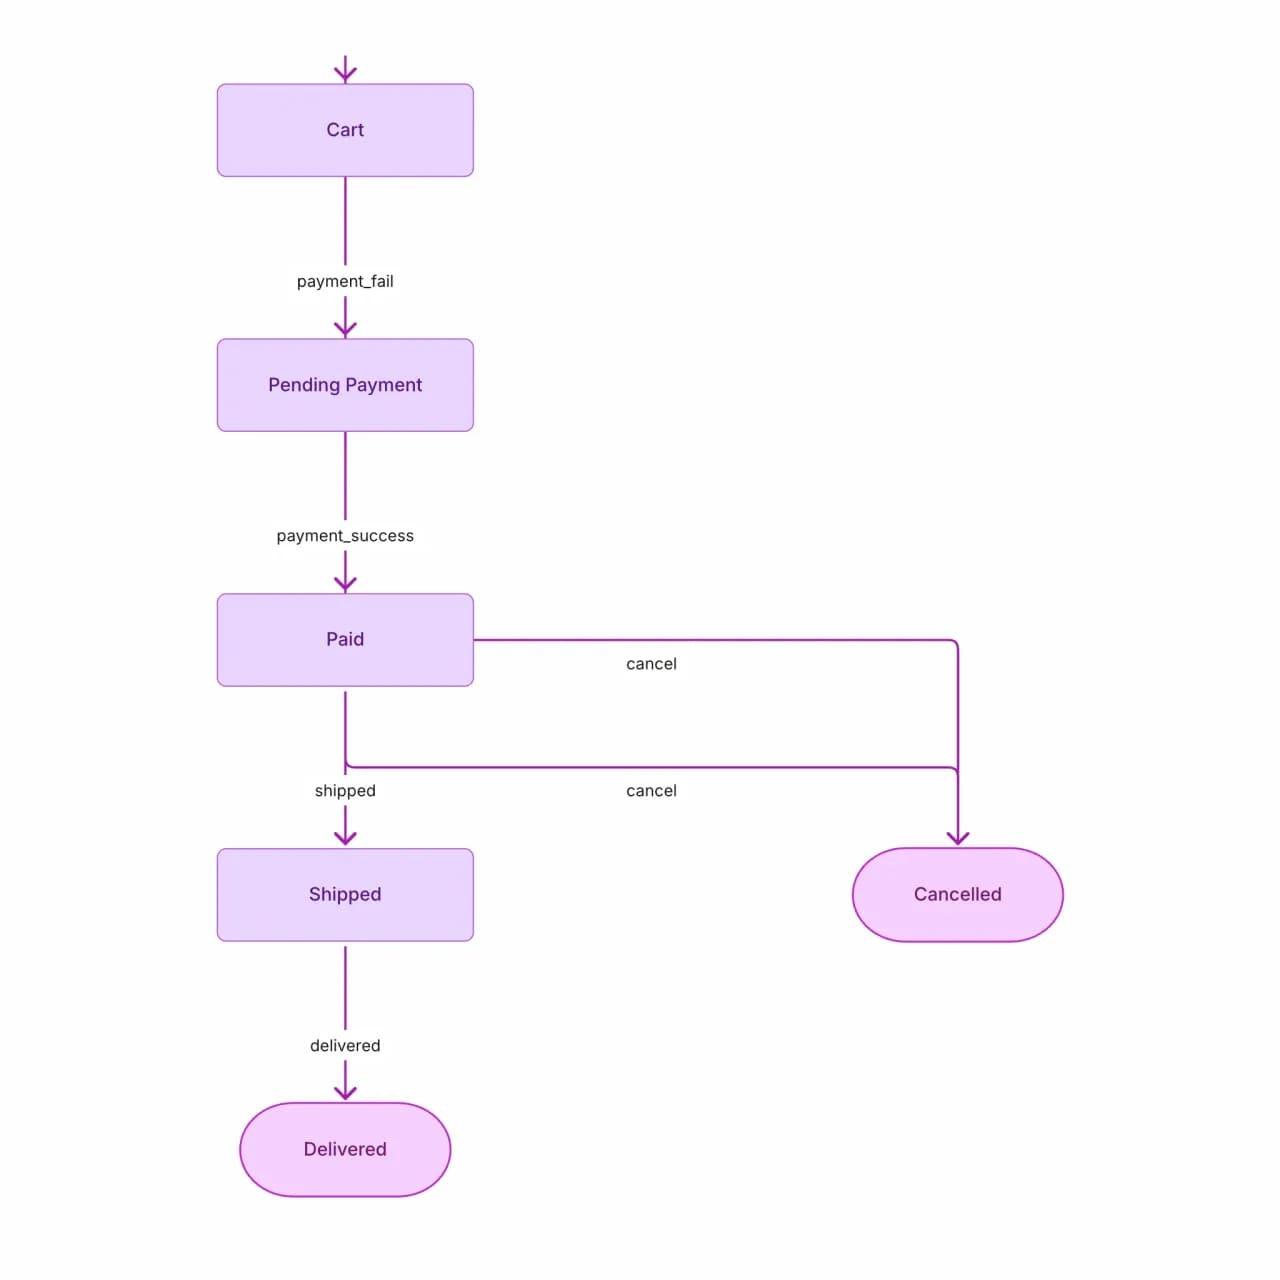
What the AI produces
The "from anywhere before Shipped" cancel transition is rendered as separate edges from each pre-Shipped state — most state-diagram tools handle this clumsily; Flowova handles it cleanly because the AI understands the implicit "anywhere" constraint.
What is a state diagram maker?
Describe a state machine — "an order starts in Cart, becomes Pending Payment on checkout, transitions to Paid on success or Cancelled on payment failure" — and Flowova produces a state diagram with circular state nodes, directional transition arrows, transition labels, and explicit initial/final markers. Useful for documenting protocol state, application state in a Redux/XState style, or business-object lifecycles. Hierarchical states (substates) work too, but read better when each level is generated as a separate diagram.
Create a State Diagram in Minutes
Describe Your States
Describe the states and transitions. States are nouns (Pending, Approved, Shipped); transitions are events with optional guards/actions (on payment_received [if amount > 0] / send_confirmation).
- Describe states and transition events
- Initial and final states explicit or inferred
- Self-loops supported for stay-in-state events
AI Creates Your Diagram
The AI generates a UML state diagram with rounded-rectangle states, arrows labeled with events, and special states (initial dot, final ringed circle).
- Circular state nodes with directional transitions
- Transition labels match your event names
- Hierarchical states read better as separate diagrams
Customize and Export
Add nested states (composite states), parallel regions, or history pseudo-states. Export as PNG/SVG or Mermaid stateDiagram syntax.
- Re-route transitions by dragging endpoints
- Theme for protocol docs vs. team review
- Free PNG; SVG and Mermaid are Pro
State Diagram Maker Features
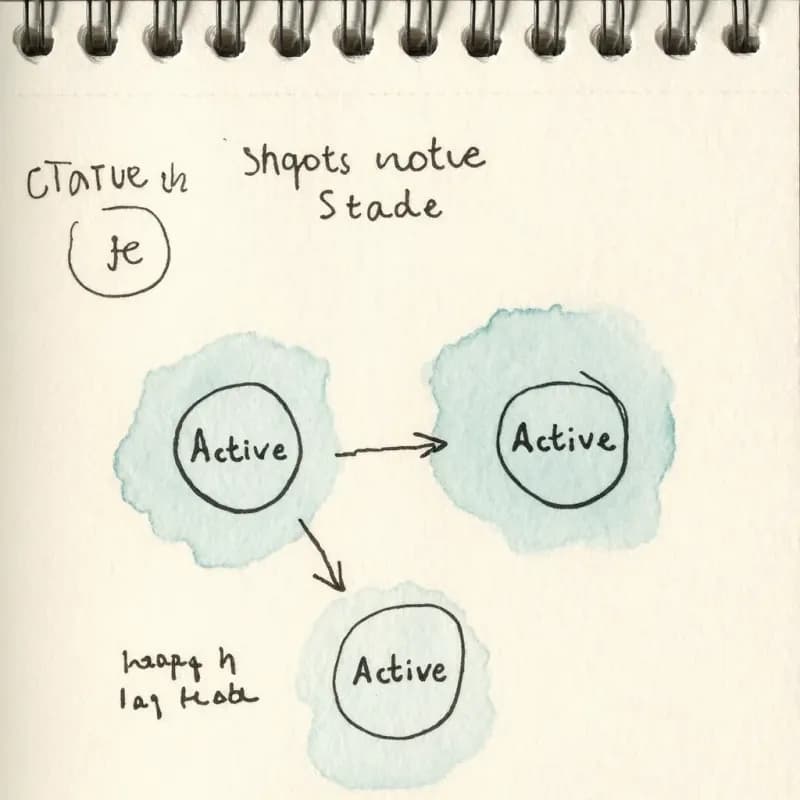
Initial and Final Markers
Initial state renders with a filled circle prefix; final state with a double-circle. UML-compliant notation that auditors recognize.
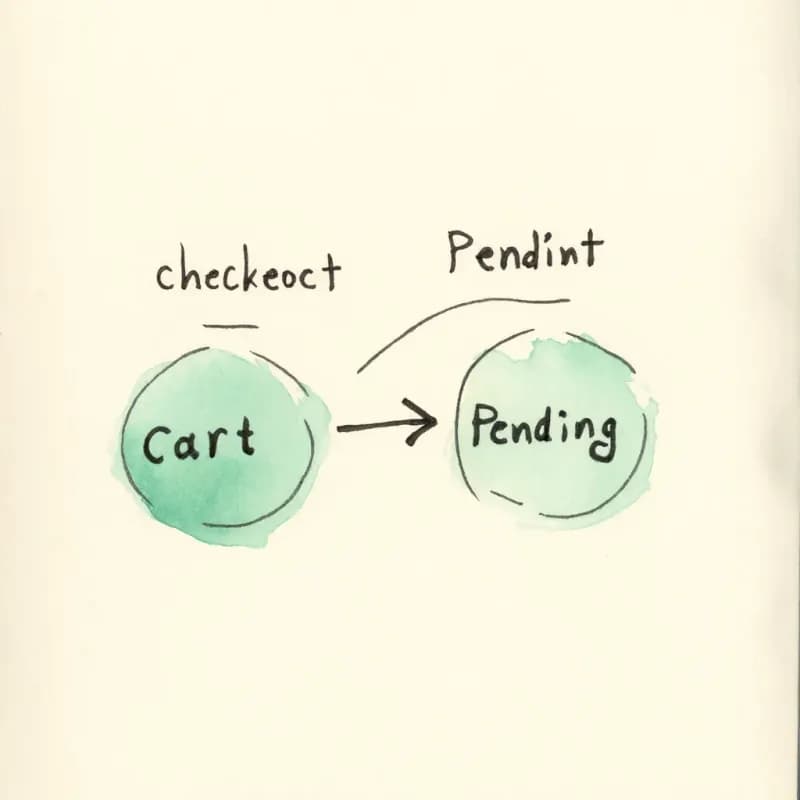
Transition Labels
"Cart becomes Pending Payment on checkout" labels the transition arrow with "checkout" — the event that triggered the state change.
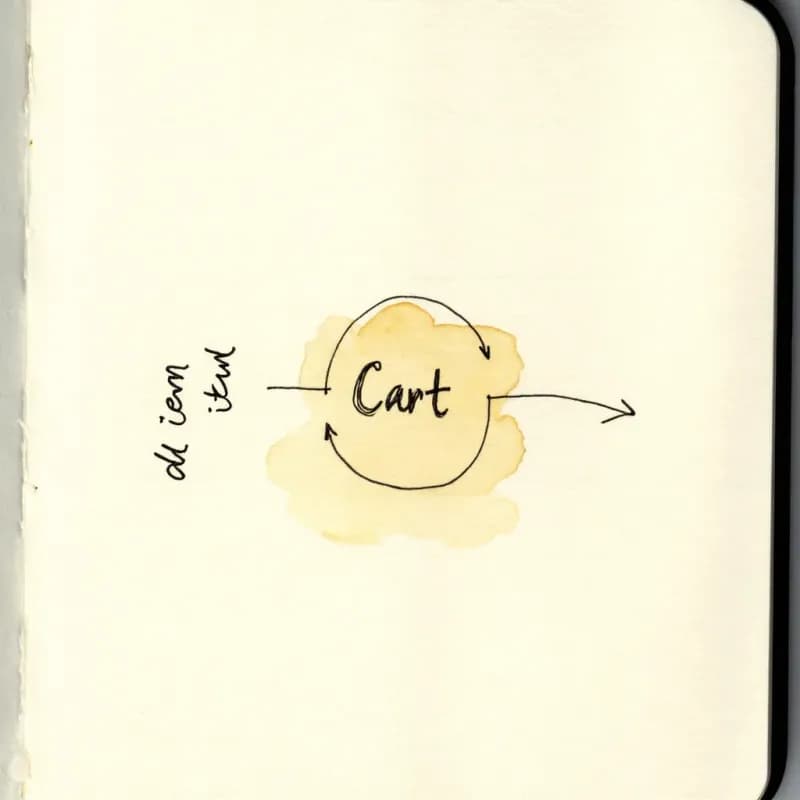
Self-Loops for Stay-in-State
"Customer adds items (stays in Cart)" renders as a self-loop on the Cart node labeled "add items" — common for retry, refresh, and accumulation patterns.
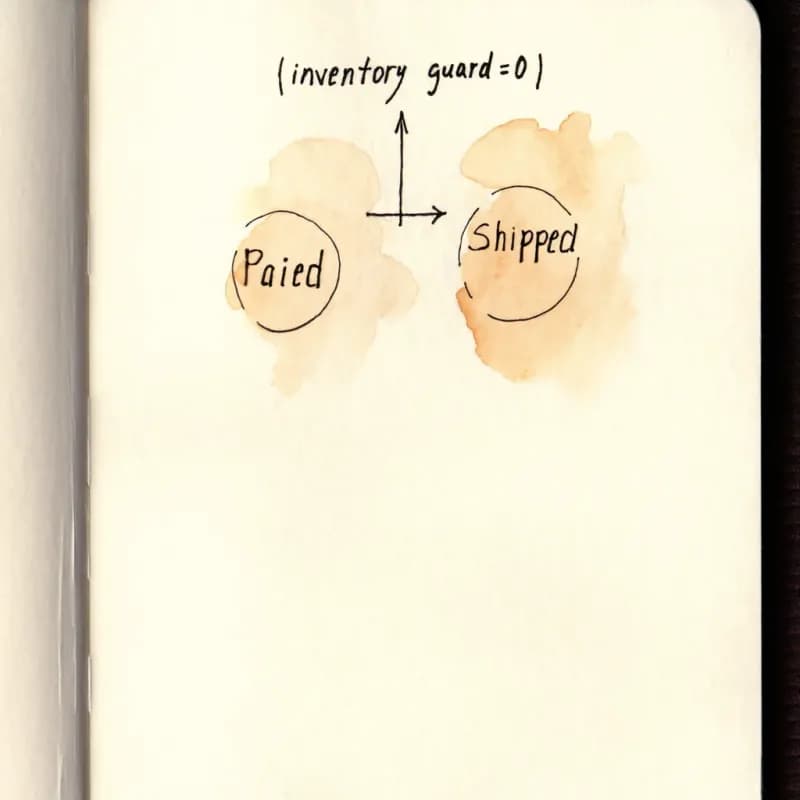
Guard Conditions
"Paid → Shipped only if inventory available" renders the inventory-check guard inline on the transition, matching UML state-diagram conventions.
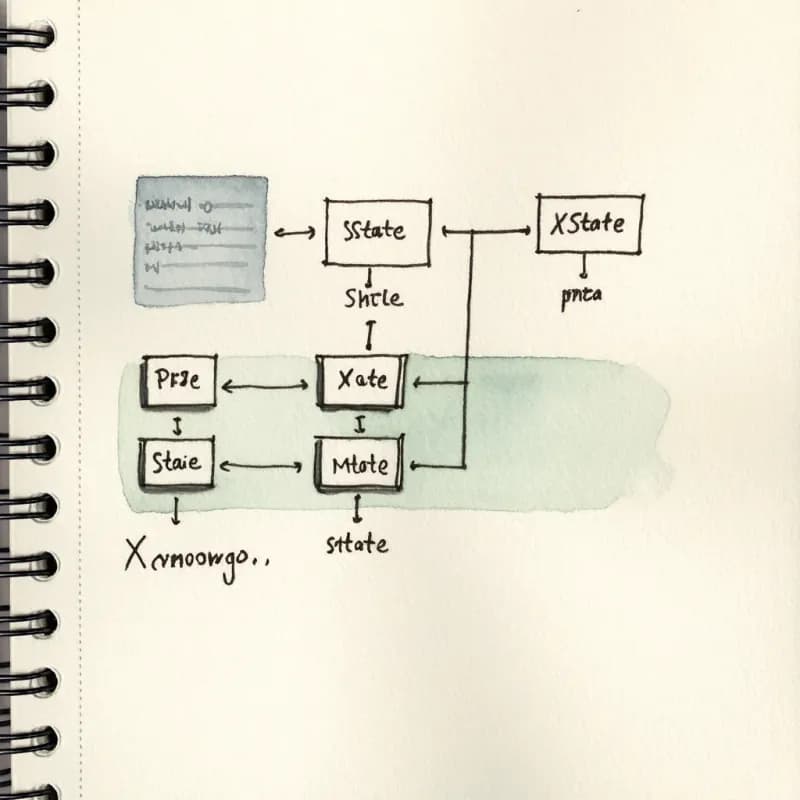
XState / Redux-Style Modeling
Output structure aligns with XState v5 or Redux Toolkit state machines — useful for documenting the model before implementing it in code.
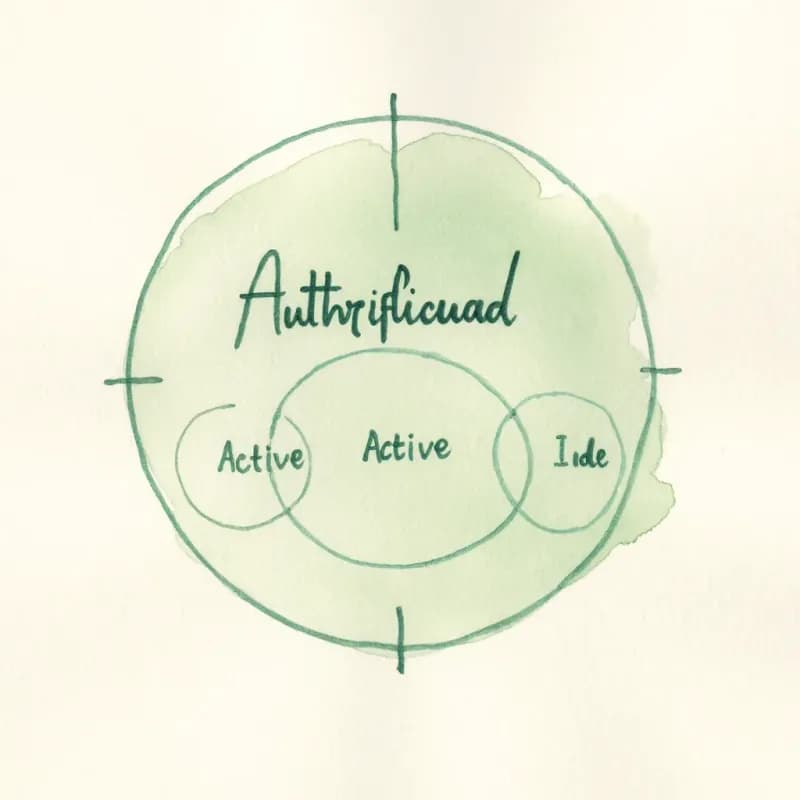
Hierarchical States Split
Substates ("Authenticated has Active and Idle") read better as a separate sub-diagram. Flowova generates the top-level; ask for sub-states in a second prompt.
When to use state diagrams
Use this tool for
- Order, payment, or document lifecycle modeling — every named state and the events that move between them.
- UI state machines — the loading, success, error, and empty states a component cycles through, plus the events that flip them.
- Hardware or firmware mode documentation where what the device is doing depends on which mode it's in.
- QA test planning — list every state the system can be in and verify each transition has coverage.
Use a different tool for
- Sequence of API calls during a single request — Sequence Diagram Maker is the right shape; states are not the same as messages.
- Process steps with no inherent state distinction — a flowchart is more compact when the 'state' is just the step number.
- Data structures themselves — ER Diagram Generator is for relational schemas, not state diagrams.
- Very large state machines with 20+ states — readability collapses; a state-machine framework like XState or the Stately editor handles big machines better.
State Diagram Maker FAQ
Related guides
Sequence Diagram Guide: What It Is, UML Notation, and How to Make One Online
Learn what a sequence diagram is, how UML notation works, and when to use one for API design, microservices, and auth flows. Includes an AI sequence diagram option.
What Is a Flowchart? Definition, Symbols, and Real-World Examples
What is a flowchart? A complete definition with core symbols, types of flow chart models, real-world uses, and when to use (or skip) them. Practical examples included.
Ready to Try the AI Flowchart Generator?
Join tens of thousands of professionals who use Flowova to visualize their ideas. Start creating flowcharts with AI in seconds.
Get Started Free