Free AI Data Flow Diagram Maker
Transform system descriptions into professional data flow diagrams instantly. Describe how data moves through your system - AI creates the visual DFD.
A real Level-1 DFD from a paragraph
No Yourdon notation knowledge required.

Input
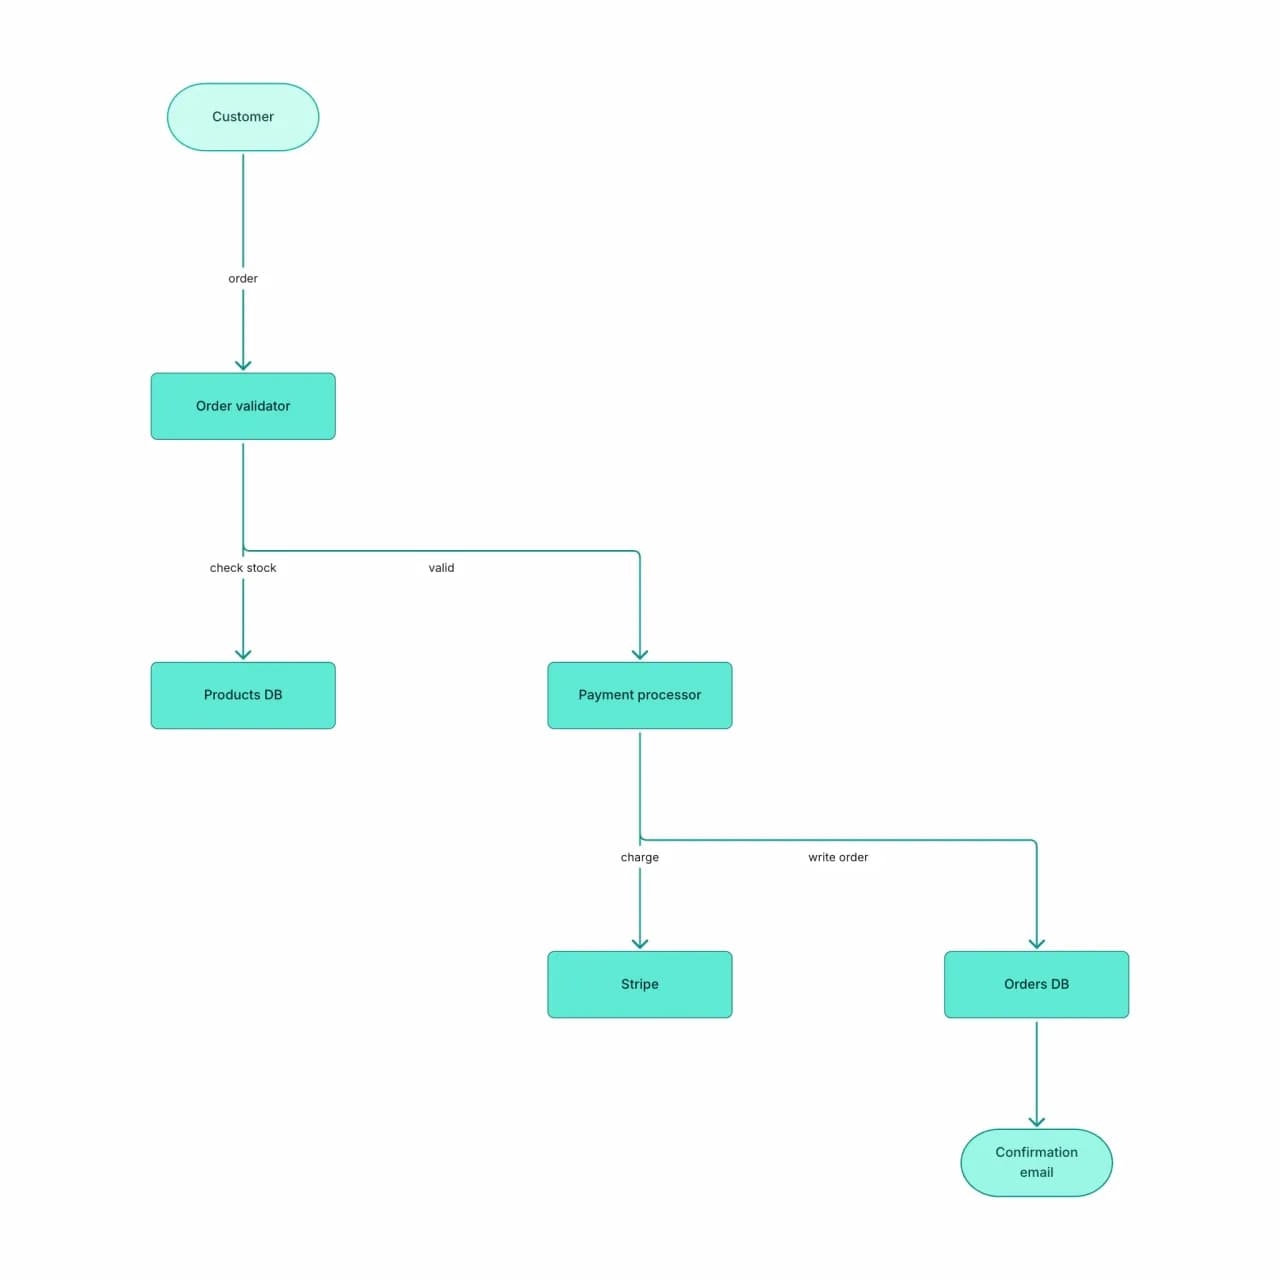
What the AI produces
External entities (Customer, Stripe, Warehouse) are correctly identified as outside the system boundary, not as processes. This distinction trips up most manual DFD attempts.
What is a data flow diagram maker?
Describe how data moves through your system — sources, processes, data stores, sinks — and Flowova produces a DFD using the Gane–Sarson or Yourdon notation: rectangles for external entities, circles or rounded-rectangles for processes, open-ended rectangles for data stores, and labeled arrows for the data itself. It generates at Level 0 (context), Level 1, or Level 2 depending on the depth you describe. Common for system-design docs, threat modeling, and architecture reviews. State 'Level 1' or 'context diagram' in your prompt to control the elevation.
Build a Data Flow Diagram Easily
Describe Data Movement
Describe what data exists in your system and how it moves. Mention external sources (users, third-party APIs), processes (validate, transform, route), and data stores (database tables, queues, files).
- External entities, processes, data stores, sinks
- State level in your prompt: 'Level 0', 'Level 1', 'context'
- Gane–Sarson or Yourdon notation, your choice
AI Creates Your DFD
The AI applies Yourdon/DeMarco or Gane/Sarson notation and assigns each element to a level: Level 0 (context diagram with single process) or Level 1 (decomposed processes). You can specify the level or let the AI choose.
- External entities as rectangles, processes as circles
- Data stores as open-ended rectangles
- Each arrow labeled with the data flowing
Customize and Export
Refine process names, rename data stores to match your real schema, drill into a process to make a child DFD, and export as PNG/SVG. DFDs scale well — start with a Level 0 and decompose later.
- Decompose process bubbles into Level 2 in a second pass
- Free PNG; SVG and Mermaid are Pro
- Theme for security review or architecture doc
Data Flow Diagram Maker Features
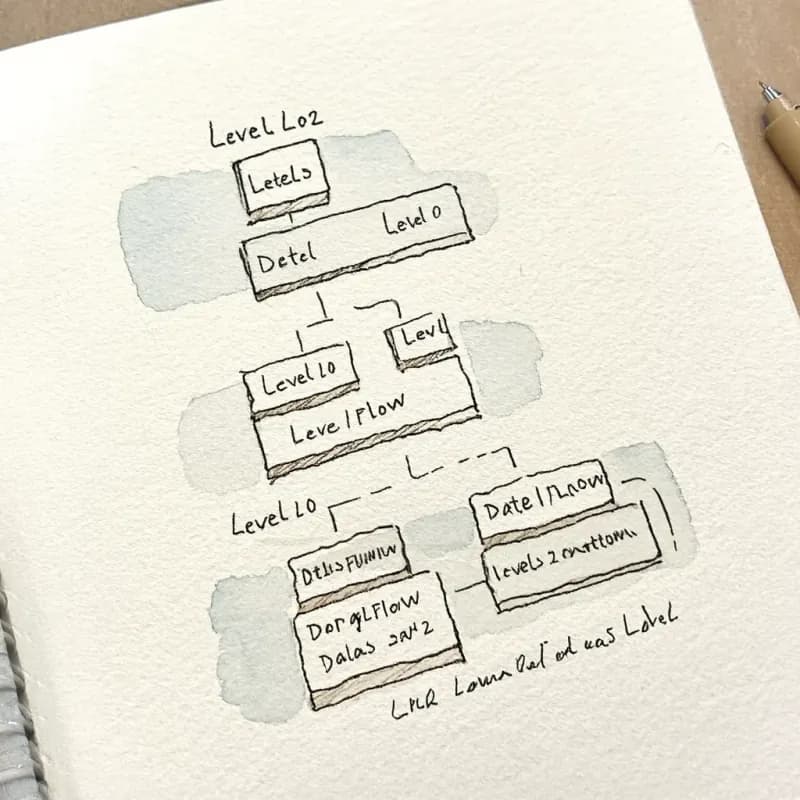
Three Levels of Decomposition
Level 0 (context, single process), Level 1 (3-7 sub-processes), Level 2 (further decomposed). Specify level in the prompt or default to Level 1.
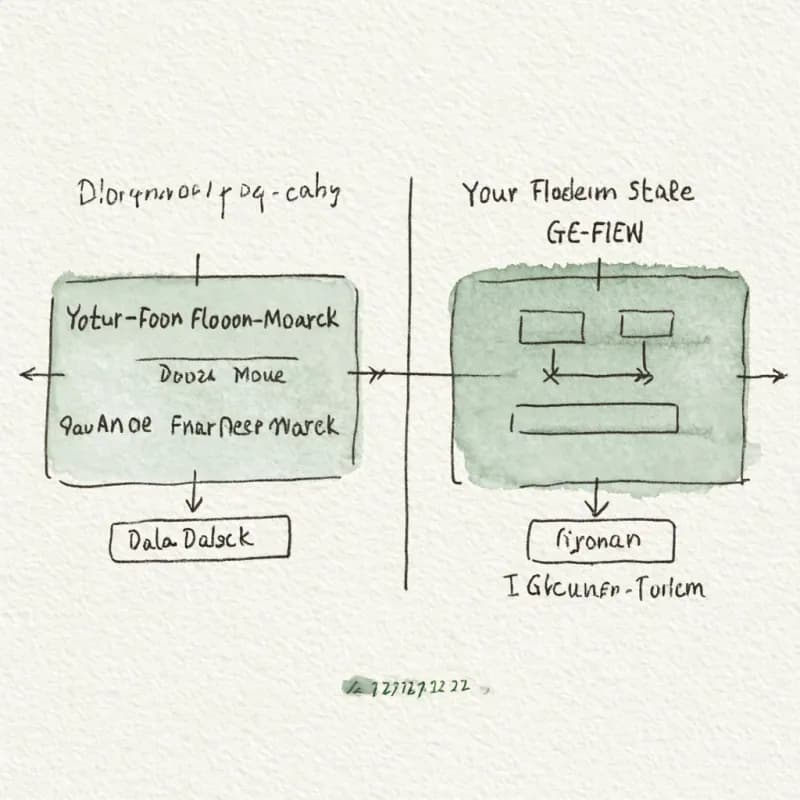
Yourdon and Gane-Sarson
Yourdon-DeMarco notation by default; switch to Gane-Sarson in the prompt. Both are industry-standard DFD conventions.
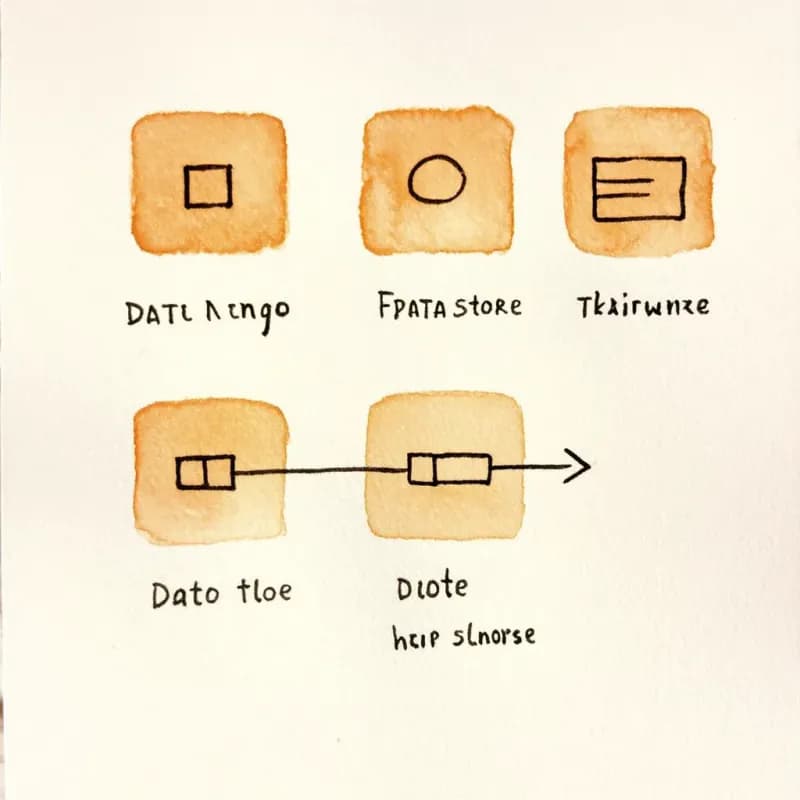
Four Element Types
External entities (rectangles), processes (circles), data stores (open-ended rectangles), and labeled data flows (arrows with named data).
Labeled Data Flows
Every arrow names the data flowing on it ("customer details", "validated order", "auth token") — required for proper DFD notation, often skipped by other tools.
Threat Modeling Ready
Output supports STRIDE threat modeling workflows — trust boundary lines can be added inline after generation, and the DFD format matches what auditors expect.

Decompose Workflow
After generating Level 1, double-click a process to decompose it into a Level 2 in a separate diagram — keeps the parent diagram readable.
When to use the data flow diagram maker
Use this tool for
- Documenting how data moves through a system for a formal technical spec, architecture review, or RFC.
- Mapping integrations in a microservice or ETL architecture — sources, transforms, sinks, and the data each link carries.
- Producing the diagram architects and platform-engineering reviewers expect: external entities, processes, data stores, and labeled flows.
- Explaining the system to non-engineering stakeholders — DFDs read more like a picture than UML class diagrams do.
Use a different tool for
- Algorithm or control flow — DFDs describe data, not order of operations. Use a flowchart for step-by-step logic.
- Database schema design — ER Diagram Generator captures tables and joins; a DFD shows movement, not structure.
- Message-level interactions between services where call order matters — Sequence Diagram Maker preserves ordering DFDs intentionally abstract away.
- STRIDE threat-modeling sessions that need trust-boundary overlays — generate the DFD here, then overlay the dashed boundaries in Figma, Excalidraw, or a dedicated tool like Microsoft Threat Modeling Tool.
Data Flow Diagram FAQ
Related guides
Data Flow Diagrams (DFD): Levels 0, 1, 2, Symbols, and Examples
Learn how to create a DFD with the right notation. Covers DFD level 0, level 1, level 2, Yourdon-DeMarco vs Gane-Sarson symbols, and real-world examples.
ER Diagram Guide: Entity Relationship Diagrams, ERD Symbols, and Examples
Learn how to draw an ER diagram (ERD) for database design. Covers entities, attributes, relationships, cardinality, Chen vs Crow's Foot notation, and real schema examples.
Flowchart Symbols Cheat Sheet: Meanings, Shapes, and Examples
A quick visual guide to flowchart symbols and meanings: start/end, process, decision, input/output, connectors, documents, data stores, and common mistakes.
Ready to Try the AI Flowchart Generator?
Join tens of thousands of professionals who use Flowova to visualize their ideas. Start creating flowcharts with AI in seconds.
Get Started Free