Free Excel to Flowchart Converter
Transform Excel spreadsheets, process tables, and CSV data into clear visual flowcharts instantly. Perfect for data-driven process visualization.
Drop your Excel file here
or click to browse (up to 10MB)
A step list in Excel, converted
When the source of truth is a spreadsheet.
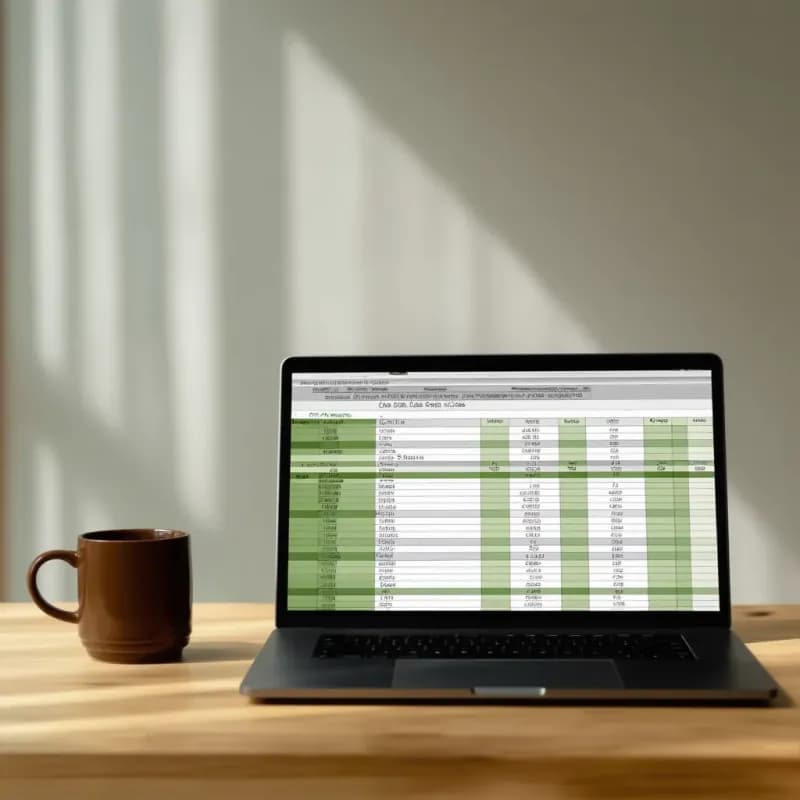
Input (Excel structure)
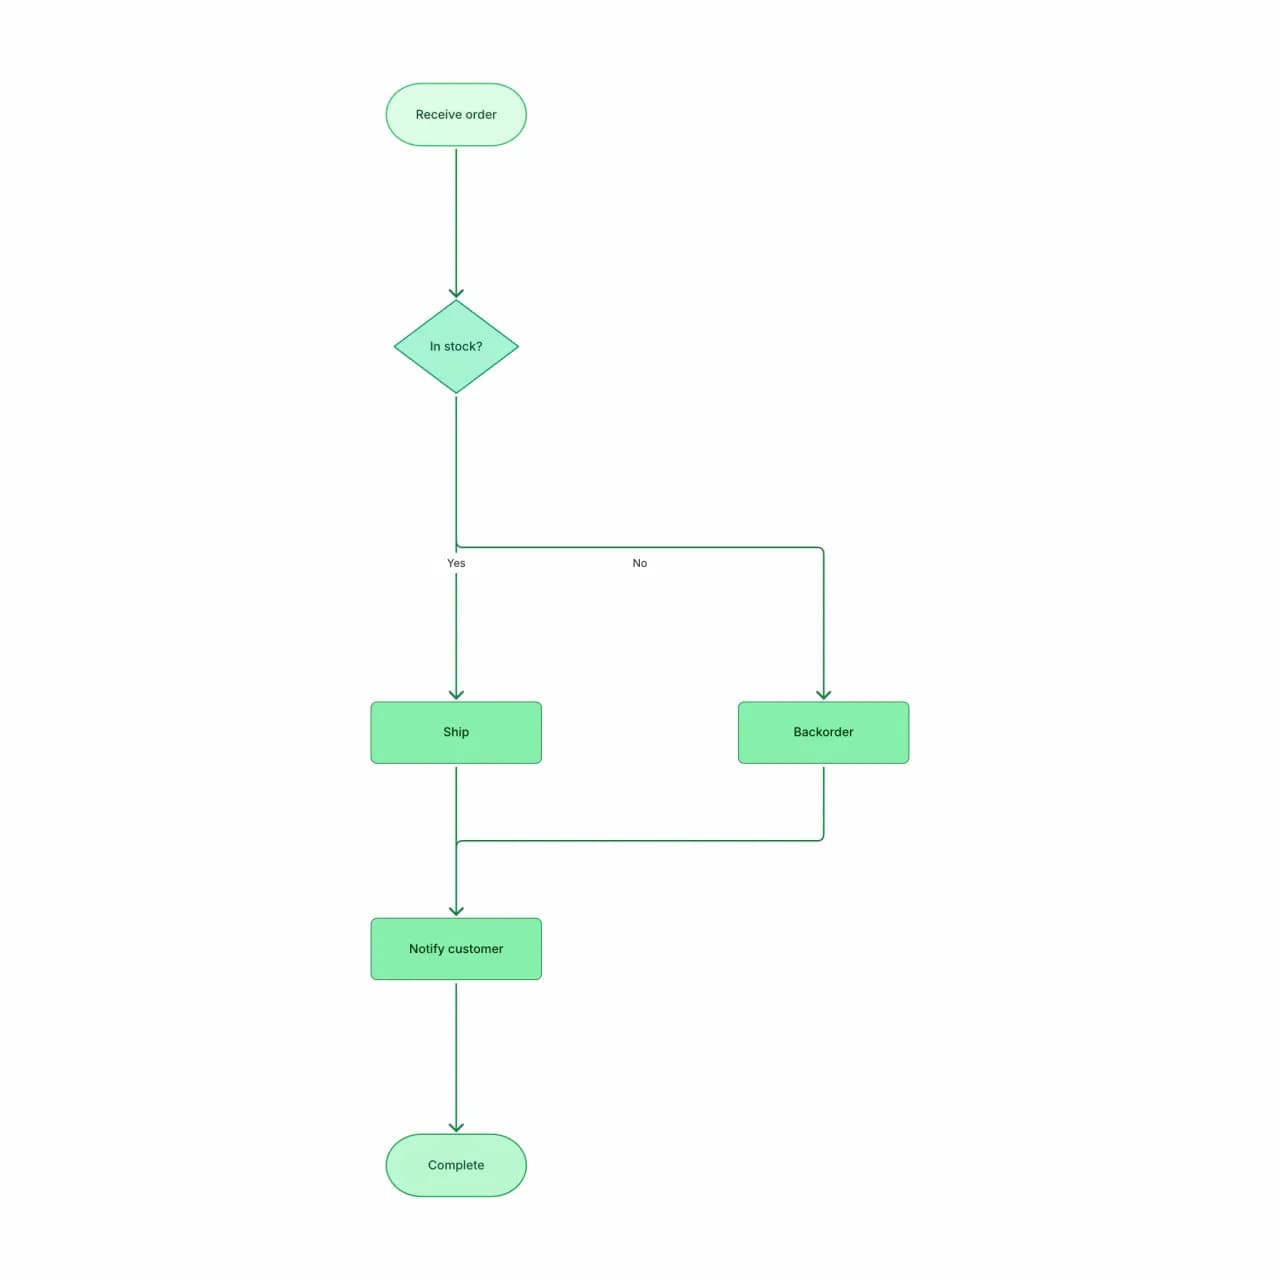
What the AI produces
Spreadsheets are the most common form of "process documentation" in many companies — converting them to diagrams suddenly makes the flow visible and reviewable.
What is Excel-to-flowchart conversion?
Upload .xlsx, .xls, or .csv files where each row is a step (with optional next-step or yes/no branch columns) and Flowova builds a flowchart from the table. Two table shapes work especially well: simple sequence tables (one row per step) and decision tables with explicit Yes/No next-step columns. Tables that mix process rows with unrelated reference data confuse the extraction — trim the sheet down to just the procedure rows before uploading.
Convert Excel Data to a Flowchart
Upload Your Spreadsheet
Upload an Excel (.xls, .xlsx) or CSV file (max 10MB). Best format: each row represents a step, columns can represent step number, description, owner, decision branches.
- .xlsx, .xls, .csv accepted
- Up to 10MB on free, 30MB on Pro
- One sheet per upload — trim to procedure rows
AI Interprets Data
Flowova reads the spreadsheet, identifies the sequence (by row order or by a "step number" column), and infers branches from columns named "if yes," "if no," or "next step."
- Sequence tables (one row per step) work directly
- Yes/No next-step columns become decision diamonds
- Mixed reference data confuses the extraction
Customize and Export
Refine — spreadsheets often need cleanup because column meaning isn't always obvious to the AI. Theme and export.
- Edit labels and re-route arrows
- Export PNG (free) or SVG (Pro) for audit binders
- Theme for brand or operations context
Excel to Flowchart Features
Three Spreadsheet Formats
.xlsx, .xls, .csv accepted. Up to 10MB on free, 30MB on Pro. One sheet per upload — for multi-sheet workbooks, the first sheet is used by default.
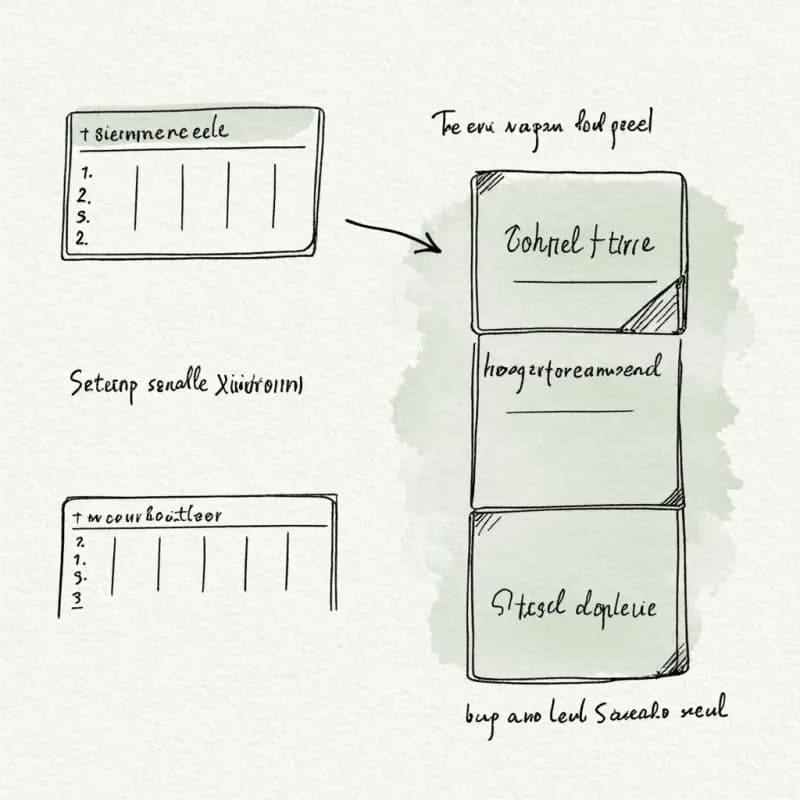
Sequence-Table Shape
Tables with one row per step ("Step #, Description") convert linearly. Optional "Next Step" column overrides the default top-to-bottom ordering.
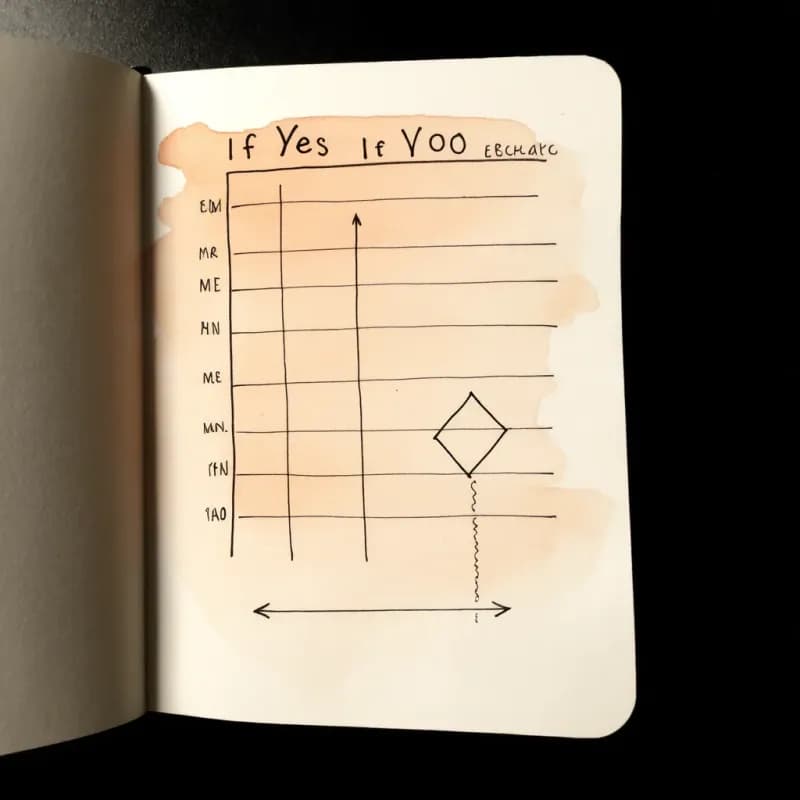
Decision-Table Shape
Tables with explicit "If Yes" / "If No" columns generate decision diamonds with the named next-step routing — no ambiguity about the branch.
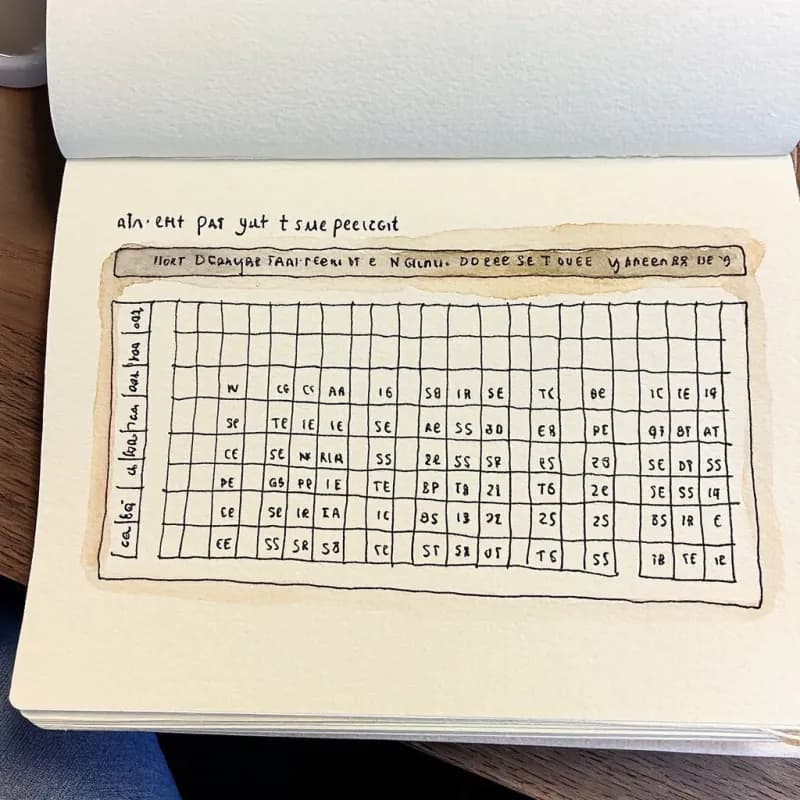
Header Row Auto-Detection
The first row is treated as headers when the cells contain non-numeric labels. Override by adding a blank row at the top before uploading.
Mixed Data Cleanup
Sheets that mix process rows with unrelated reference data confuse extraction — trim down to just the procedure rows before uploading for best results.
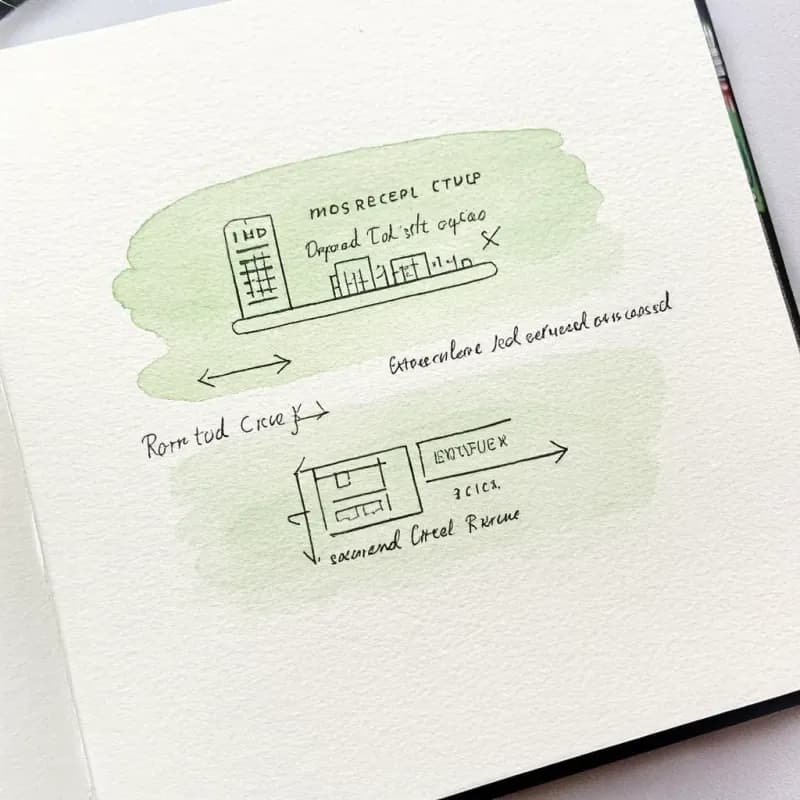
Back to CSV via Export
After visual edits, the diagram can be re-exported back to a CSV of (id, label, type, next, condition) — useful for keeping process data in source control.
When to use excel-to-flowchart
Use this tool for
- A decision table that lives in Excel — one row per step, 'if yes / if no' columns — turn it into a diagram in one upload.
- Process documentation maintained by an ops analyst in Excel that needs a visual version for the next team review.
- Auditing decision logic in a spreadsheet for completeness — the diagram surfaces missing branches the analyst overlooked.
- Bridging analyst-maintained Excel sources with team-shared visual docs without a manual rebuild.
Use a different tool for
- CSV files that are pure data dumps with no procedural structure — a flowchart isn't the right output for raw data.
- Cells whose meaning lives in conditional formatting (colors, bold) — the parser reads displayed values only; encode branches in columns instead.
- Multi-sheet workbooks — only the first sheet is read. Save the relevant sheet as its own .xlsx.
- Apple Numbers (.numbers) or Google Sheets links — export to .xlsx or .csv from those tools first.
Excel to Flowchart FAQ
Related guides
Process Mapping: A Practical Guide to Documenting Any Workflow (2026)
Learn how to create effective process maps for your organization. Covers types of process maps, step-by-step methodology, common frameworks (SIPOC, value stream), and best practices.
How to Make a Flowchart: A Complete Beginner Guide for 2026
Learn how to create effective flowcharts from scratch. This step-by-step guide covers flowchart basics, symbol meanings, design tips, and the best tools to use in 2026.
Ready to Try the AI Flowchart Generator?
Join tens of thousands of professionals who use Flowova to visualize their ideas. Start creating flowcharts with AI in seconds.
Get Started Free