Free Process Flow Diagram Maker
Describe your process step by step - inputs, transformations, decisions, and outputs. AI generates a professional process flow diagram with standard symbols and logical structure.
A manufacturing PFD
Operations and material flow.
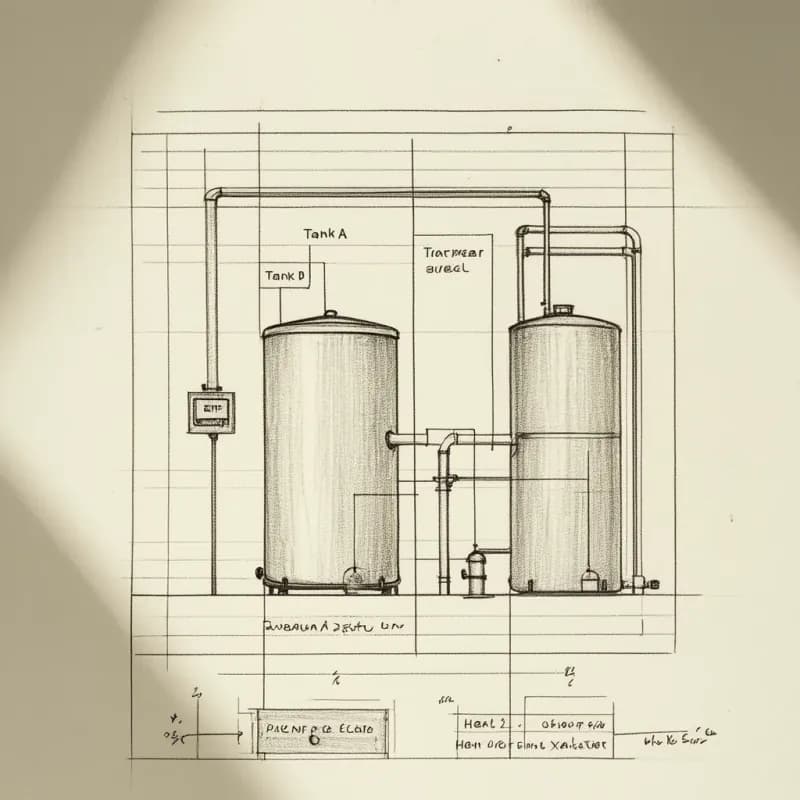
Input
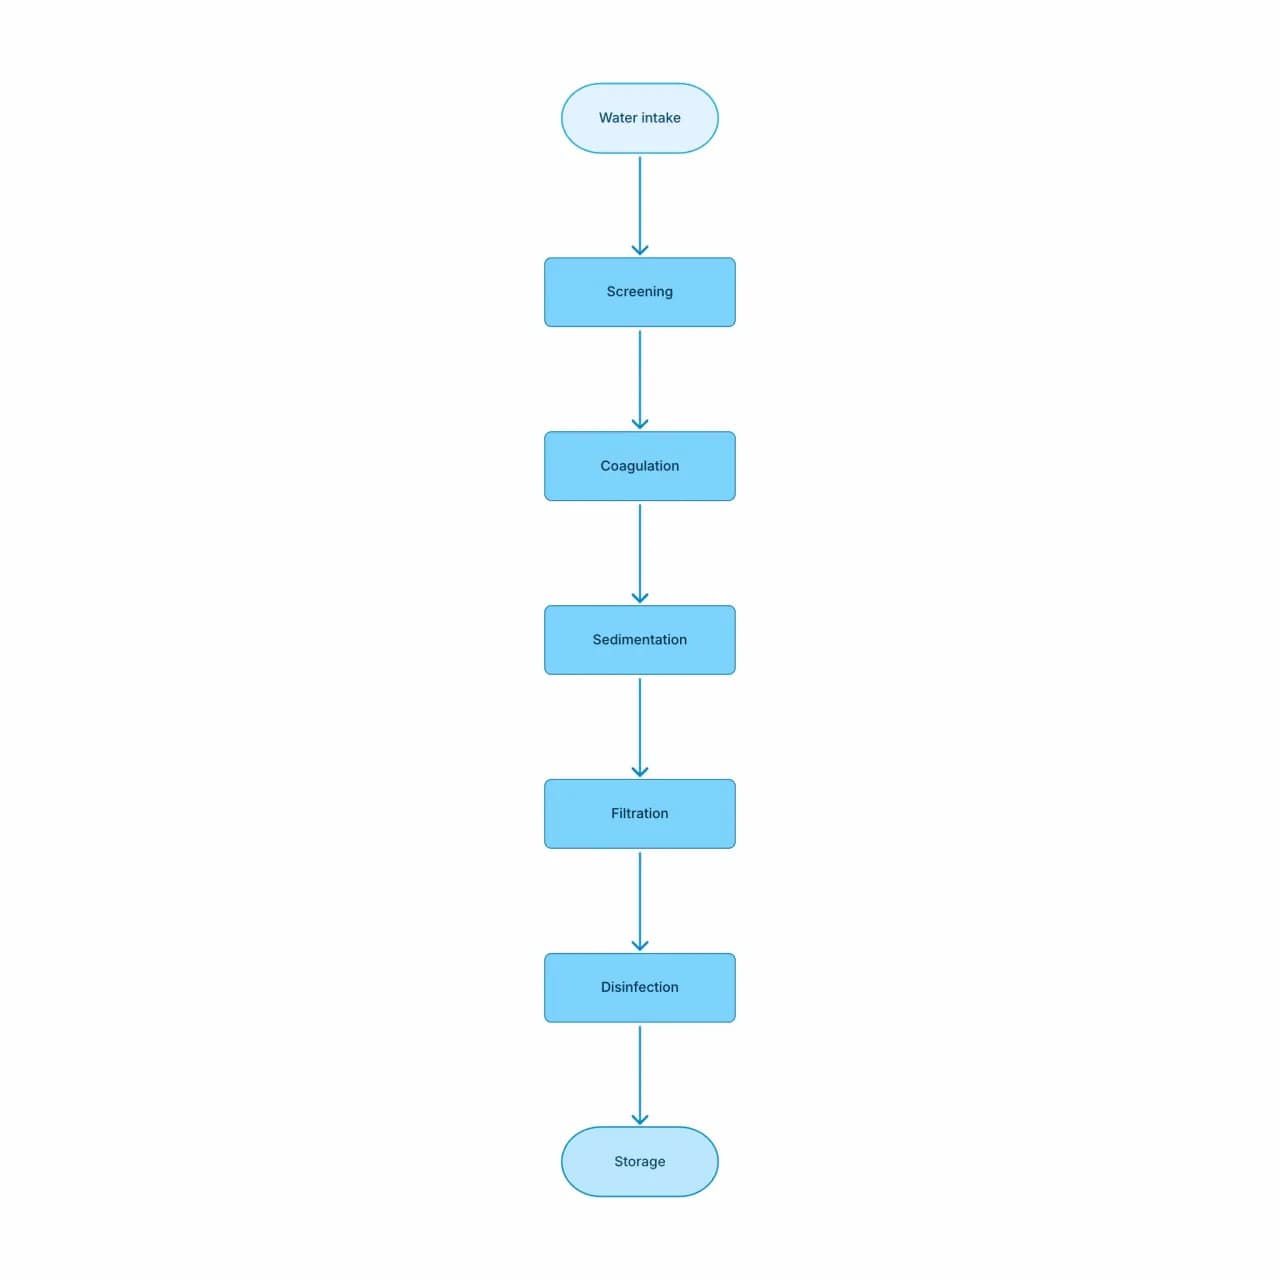
What the AI produces
PFDs in manufacturing often have feedback loops (re-processing, recycling) — visualizing these makes the loop's entry and exit conditions explicit.
What is a Process Flow Diagram (PFD)?
A PFD is the high-level visual for an industrial or engineering process — chemical plants, manufacturing lines, water treatment, energy systems — showing major unit operations, mass and energy streams, and decision points without the field-level detail of a P&ID. Flowova's PFD maker takes a plain-language description ("raw water → screening → coagulation → sedimentation → filtration → disinfection → distribution") and lays out a PFD with consistent symbol use and labeled streams. For piping-level instrumentation diagrams (P&IDs), pair this with a specialist CAD tool.
Create a Process Flow Diagram with AI
Describe Your Process Flow
Describe your process flow — most common in manufacturing, engineering, and operations. Include inputs, major operations, and outputs.
- Describe inputs, outputs, unit operations, streams
- Manufacturing, chemical, water, energy processes
- For P&ID-level detail, pair with a CAD tool
AI Generates the PFD
The AI generates a PFD with operation symbols (rectangles), I/O boundaries (parallelograms), and decision diamonds. PFD conventions sit between strict process maps and engineering schematics.
- Stream labels preserved (flow rate, composition)
- Feedback loops shown as labeled back-edges
- Parallel streams rendered side-by-side
Refine and Export
Refine for your industry — chemical engineering PFDs have additional symbols (valves, pumps, tanks) that are partially supported. Theme and export.
- Edit stream labels and unit operations inline
- Theme for technical review vs. operations
- Free PNG; SVG (Pro) for vector documentation
Process Flow Diagram Features
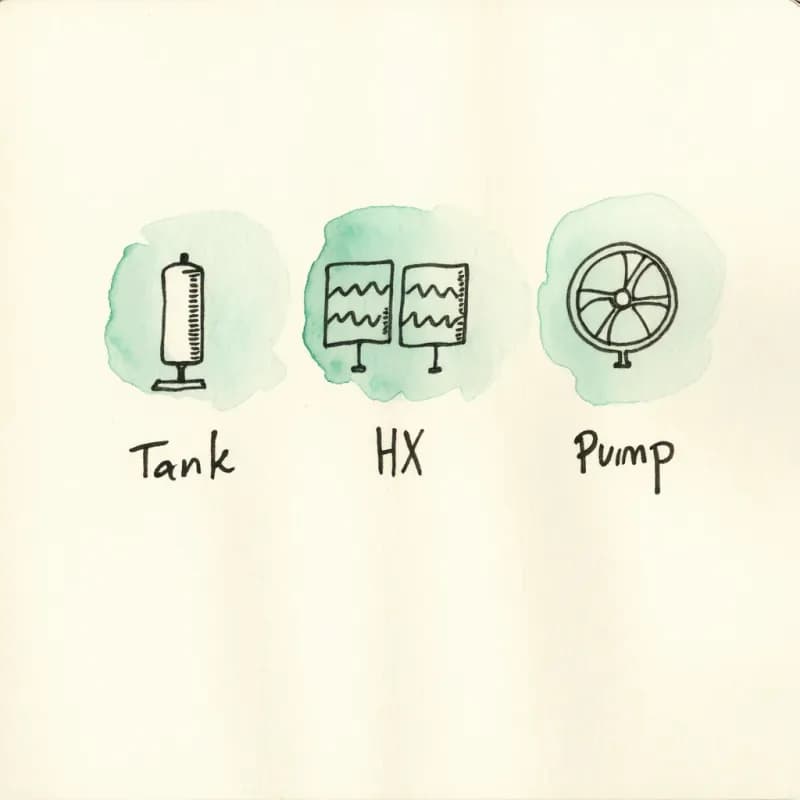
Engineering Symbol Library
Unit operations (tanks, pumps, heat exchangers, columns, reactors), instrumentation, and stream labels follow ISA-5.1 visual conventions.
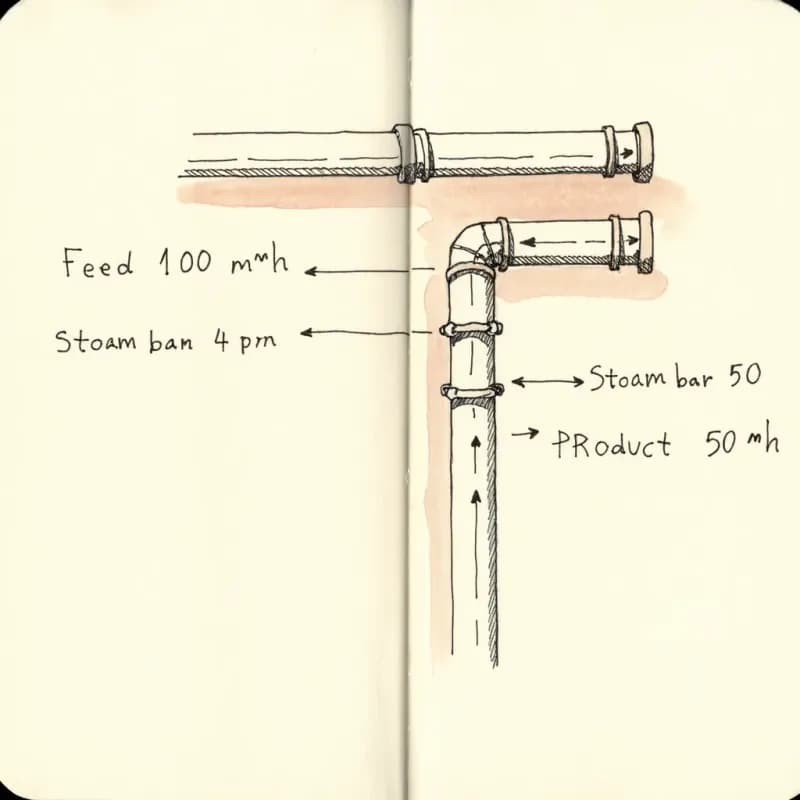
Labeled Streams
Every line names what flows through it — "feed water 100 m³/h", "steam 4 bar", "product to Tank B" — required for proper PFD interpretation.
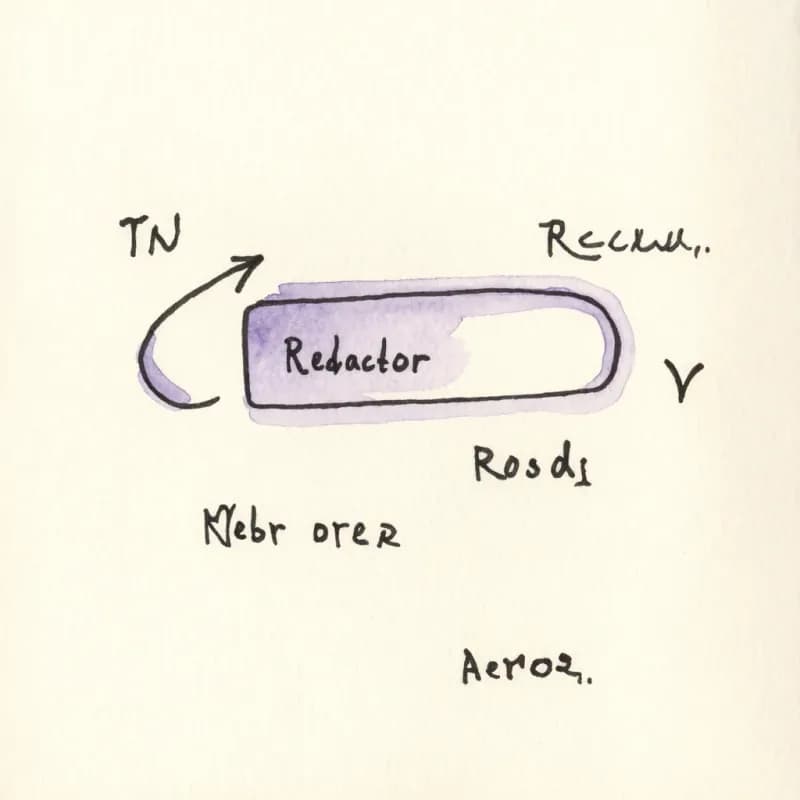
Feedback Loops
Recycle streams ("reject stream returns to upstream column") render as labeled back-edges, not as forward flows, so the process logic stays clear.
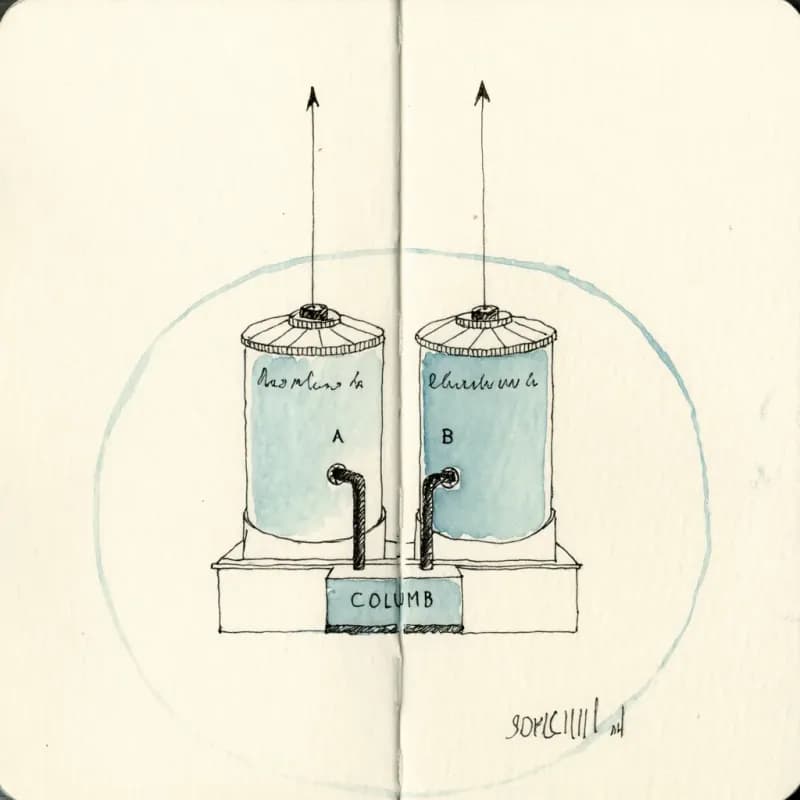
Parallel Streams
Two parallel units (Tank A and Tank B both feeding the same downstream column) render side-by-side with merge points, matching real plant layouts.
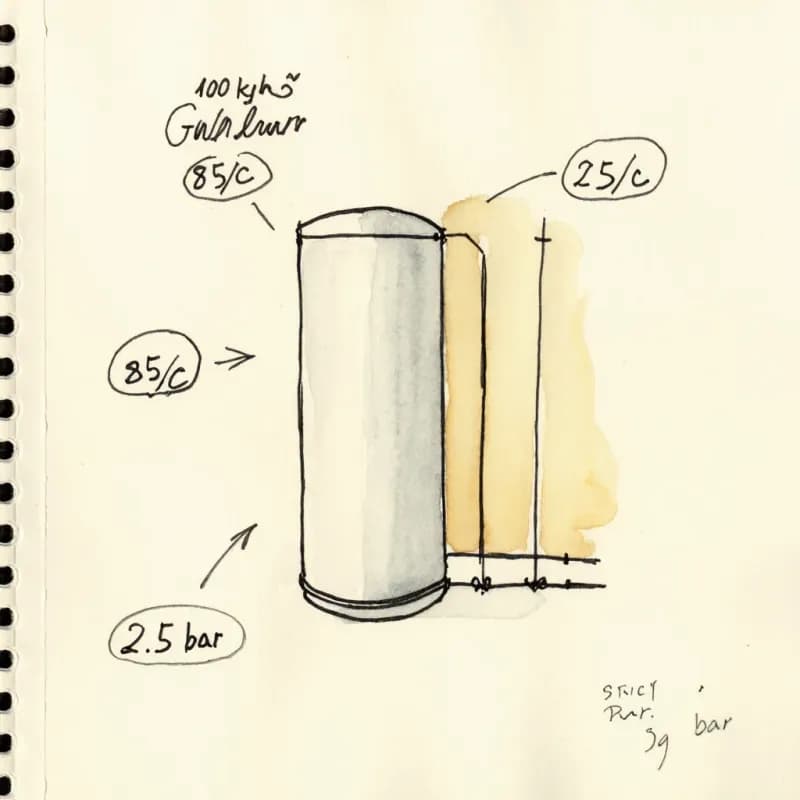
Mass and Energy Annotations
When your description includes mass balance or energy notes ("100 kg/h in, 95 kg/h out"), they survive as inline labels on the relevant stream.
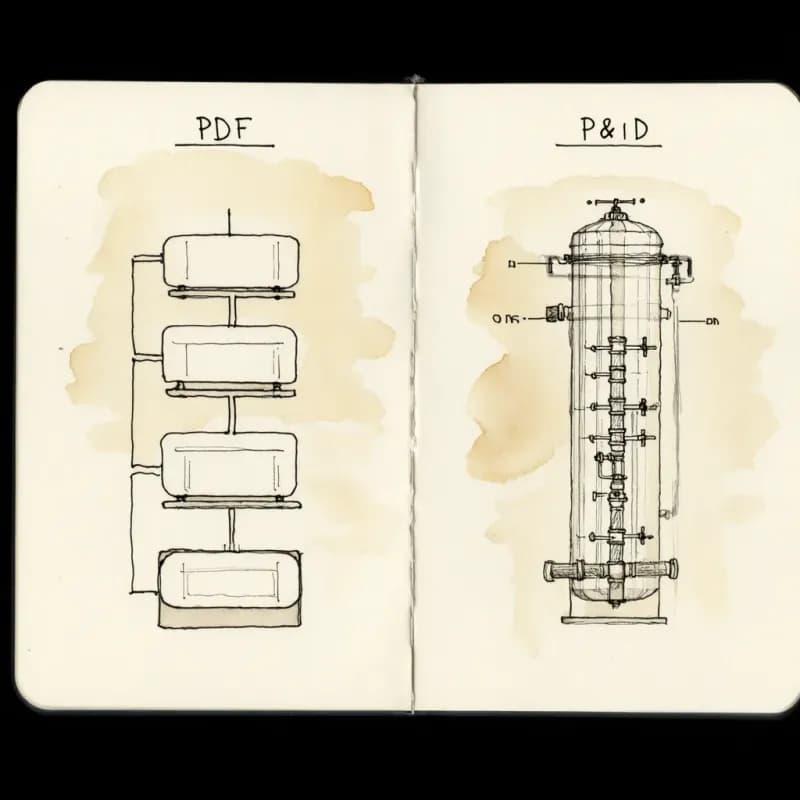
Not P&ID Detail
PFDs show major units and streams. For piping and instrumentation diagrams (P&IDs) with field-level detail, pair with a specialist CAD tool like SmartPlant or Aveva.
When to use process flow diagrams
Use this tool for
- Chemical engineering process overviews — feed streams, reactors, separations, and recycle loops — for design reviews.
- Manufacturing process documentation showing major operations and material flow at the plant level.
- Pharmaceutical, food-processing, or water-treatment PFDs that need to read clearly to both engineers and quality reviewers.
- Operations workflow visualization for cross-functional production reviews.
Use a different tool for
- Detailed piping and instrumentation with valves, sensors, and controllers — a dedicated P&ID tool like AutoCAD P&ID or Lucidchart's P&ID library is the right choice.
- Generic business processes — Process Map Maker is more flexible without the engineering-flavored conventions.
- Data flow through digital systems — Data Flow Diagram Maker uses the right notation for software.
- Material-balance calculations with actual mass and energy numbers — generate the PFD here for documentation; run the math in Aspen, ChemCAD, or DWSIM.
Process Flow Diagram FAQ
Related guides
Process Mapping: A Practical Guide to Documenting Any Workflow (2026)
Learn how to create effective process maps for your organization. Covers types of process maps, step-by-step methodology, common frameworks (SIPOC, value stream), and best practices.
Data Flow Diagrams (DFD): Levels 0, 1, 2, Symbols, and Examples
Learn how to create a DFD with the right notation. Covers DFD level 0, level 1, level 2, Yourdon-DeMarco vs Gane-Sarson symbols, and real-world examples.
Ready to Try the AI Flowchart Generator?
Join tens of thousands of professionals who use Flowova to visualize their ideas. Start creating flowcharts with AI in seconds.
Get Started Free